Airspeed, Power and Fuel Consumption
Airspeed
The airspeed at which the aircraft is travelling through an air mass is referred to as true airspeed (TAS).
Unlike a car where the speed of travel relative to road surface is displayed accurately on the speedometer, the true airspeed of an aircraft cannot be accurately displayed owing to the effects of air pressure, temperature, and instrument error.
To reckon with these variable effects on true airspeed, we differentiate between two additional types of airspeed—calibrated airspeed (CAS) and indicated airspeed (IAS). TAS is determined by the manufacturer of a certified aircraft when it is built, and the TAS performance values for the aircraft are published in the form of a graph or table in the Pilot Operating Handbook.
,%20Langley%20Flying%20School.gif)
To be as accurate as possible, the manufacturer factors in speed variations for temperature and pressure. Some aircraft graphs require that you enter density altitude (see discussion P. 94), while other graphs require that you enter pressure altitude and temperature separately. The example of the cruise performance graph that appears above is similar to that which appears in the Piper Cherokee. This graph assumes that the aircraft is flown at gross weight (2150 lbs.), and that wheel fairings are not fitted to the aircraft’s undercarriage. With aircraft flown at a lighter weight, it travels faster than the speeds indicated in this graph, although we are not told how much faster. If the wheel fairings are installed, we must add 3 MPH. The example shown on the graph shows that a 75% power setting at a density altitude of 2500’ will produce a speed of approximately 125 MPH. What is a 75% power setting? Good question.
Cruise Power Setting
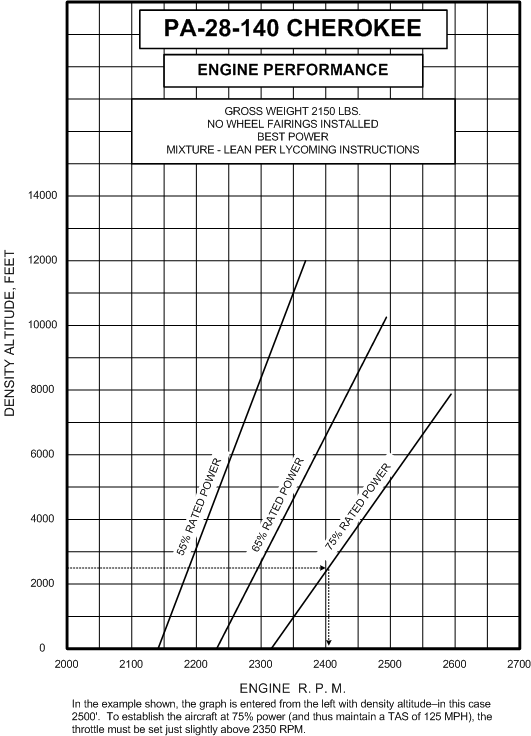
So we can see now how we determine TAS from performance graphs in an aircraft Pilot Operating Handbook—in the above graph, for the Cherokee, for example—but the question now arises as to the notion of percentage of power. To successfully predict TAS, the aircraft manufacturer has to enable the pilot to connect the instruments in the aircraft cockpit with the percentage of power used, and this of course is done with the RPM gauge—the speed at which the engine and propeller are turning. To do this, the pilot must refer to another graph (there are many!) as appears below. In the example indicated on this graph, 75% power can be established at an altitude 2500’ by setting the throttle slightly above 2400 RPM. In fact most pilots regard 2400 RPM to be the ideal power setting—engine wear is minimized, yet we retain the speed advantage of flying with a higher TAS. As altitude is increased, however, 2400 RPM will not produce the full 75% power. As can be seen in this graph, 2400 RPM at 10000’ will only produce slightly under 60% power, and this, in turn, means that TAS will be reduced from approximately 125 MPH to just under 120 MPH .

Overall, these graphs will feel somewhat foreign at first, but very quickly you will develop a sense of comfort—if only because their use is repetitive.
Fuel Consumption
On July 16, 2009, a Cessna 172P was on a VFR flight from Tofino, B.C., to Victoria, B.C. During the flight down the west coast of Vancouver Island, the pilot encountered fog along the coast and diverted inland. In the vicinity of Cowichan Lake Village, B.C., the engine sputtered and lost power. The pilot transmitted a MAYDAY call on 121.5 MHz and made a forced landing on the highway, midway between Lake Cowichan Village and Youbou, B.C. While on short final for the road, the pilot saw power lines crossing the road and elected to go under them. The aircraft touched down hard, bounced, and the left wing hit a hydro pole. The aircraft went off the left side of the road, into a ditch, and nosed over. The aircraft was substantially damaged but the three occupants were uninjured. Although the ambient temperature was high, conditions were conducive to the formation of carburetor ice. When the aircraft was recovered, it was determined that both fuel tanks were dry. No evidence could be found of fuel draining out of the tanks (no smell of fuel or sign of fuel spilled on the ground). The aircraft had flown 2.7 hr since leaving Victoria with 30 U.S. gallons of fuel on board. TSB File A09P0201.
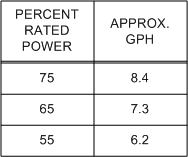
There is another crucial concept related to the cruise power settings of an aircraft, and that is fuel consumption. It is absolutely critical to a pilot’s skill set that the fuel consumption be predicted accurately. In this regard, the graphs for the Cherokee are straight forward. Inserted into the Range graphs for the Cherokee (see Pp. 9-6 and 9-7 of the Pilot Operating Handbook) is the table which appears below. This table, small and simple as it is, provides the only data presented to the pilot regarding fuel consumption requirements—with the power set to 75%, the aircraft will burn fuel at a rate of 8.4 gallons per hour (GPH)—in the case of the Cherokee, the unit is U.S. gallons. While the 8.4 GPH figure applies to a throttle setting of 2400 at an altitude of 2500’, the same throttle setting up at 10000’ will in fact consume less fuel—approximately 6.2 GPH. The reduced fuel consumption for the same throttle setting at higher altitude is primarily the result of leaning—the higher you go, the more you will have to lean in order to maintain the optimal fuel/air mixture of 1:15.1

There are three additional considerations related to fuel consumption. Firstly, the predictions made by the manufacturer in the above table are based on performance testing of a brand-new Cherokee with a brand-new paint job and a brand-new engine. Obviously, the same level of aerodynamic and engine-thrust efficiency will not occur in a working Cherokee that has accumulated lots of air time. Secondly, the above table is presented by the manufacturer on the basis of specified assumptions or preconditions. In the case of the Cherokee, the fuel consumption rates assume the aircraft is flown at maximum gross weight and that the mixture be set to best economy setting. If the actual weight of the aircraft is less than maximum gross the rate of fuel consumption will be somewhat reduced; if the mixture control is set richer (more fuel) than best economy, the rate of fuel consumption will be higher.
1 See discussion regarding fuel mixture control.
.jpg)

